Challenges and perspectives in quantitative NMR
Abstract
This perspective article summarizes, from the author's point of view at the beginning of 2016, the major challenges and perspectives in the field of quantitative NMR. The key concepts in quantitative NMR are first summarized; then, the most recent evolutions in terms of resolution and sensitivity are discussed, as well as some potential future research directions in this field. A particular focus is made on methodologies capable of boosting the resolution and sensitivity of quantitative NMR, which could open application perspectives in fields where the sample complexity and the analyte concentrations are particularly challenging. These include multi-dimensional quantitative NMR and hyperpolarization techniques such as para-hydrogen-induced polarization or dynamic nuclear polarization. Because quantitative NMR cannot be dissociated from the key concepts of analytical chemistry, i.e. trueness and precision, the methodological developments are systematically described together with their level of analytical performance. Copyright © 2016 John Wiley & Sons, Ltd.
Introduction
Quantitative NMR is almost as old as NMR itself. Indeed, quantitativity has been associated with NMR spectroscopy since its very early days, starting with the structural elucidation of organic compounds for determining the number of protons on each site of a molecule by the measurement of integrals.1, 2 In the field of analytical chemistry, the first quantitative analysis of a mixture by 1H NMR was reported in 1963 by Hollis.3 Since then, numerous methodological developments have increased the application range of quantitative NMR, which has been increasingly used in a variety of applications, such as pharmaceuticals, natural products, metabolomics, food science, isotopomics, etc.
It is interesting to note that most of the major NMR methods have been followed by their extension to quantitative analysis about 10 years later. This is for instance the case of heteronuclear NMR (with the first 13C NMR experiment in 19574 and its first quantitative applications in the 1970s5) and of multi-dimensional NMR (the concept was described in 19716 and the first quantitative analyses by 2D spectroscopy were reported in the 1980s7). More recently, hyperpolarization techniques have known a real boom since the 2000s,8 but their very first quantitative perspectives are being reported only now about 10 years later.9 There are probably two main reasons for this 10-year delay separating the description of new NMR methods from their quantitative applications: (i) Numerous specific developments and parameter optimizations are often needed before a new method can be used in a quantitative context, and (ii) there are not so many research groups willing to investigate much time in this long and meticulous task. As mentioned by Prof. Gareth Morris in his Shoolery award lecture at the SMASH conference in 2015, “quantification is important, but nobody ever said it was fun.”10 This sentence summarizes quite well the feeling of most NMR spectroscopists about quantitation: Quantitative NMR developments are often long and tedious, and they are not immediately rewarding in terms of scientific publication, as they can be quite difficult to publish in high-impact journals. Still, these developments are often an indispensable step to open new application perspectives for NMR. The determination of site-specific 13C isotope deviations at natural abundance forms an enlightening example: It requires performing 13C NMR quantitative analysis with a 0.1% accuracy and precision, a result that sounds almost as a utopia but was effectively reached through many years of methodological developments.11, 12 This result opened the way to new applications in the elucidation of biosynthetic pathways that could not be addressed by conventional methods.13
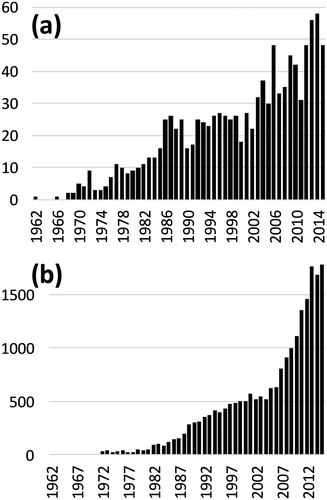
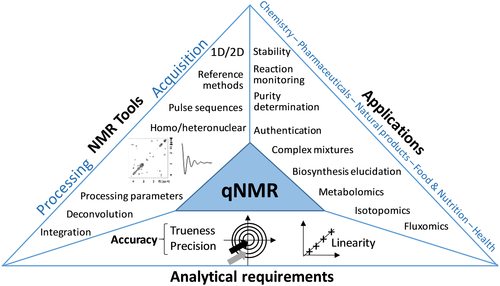
The development and applications of quantitative NMR methods have been increasingly reported in the literature, as shown by the continuously increasing number of articles whose title includes the words ‘quantitative’ and ‘NMR’ (Fig. 1a). There is a growing interest for these articles (Fig. 1b), particularly since 2005: The number of citations per year of these papers has been multiplied by 3 in only 10 years. The increasing number of applications of quantitative NMR in key domains such as pharmaceuticals and natural products is certainly a major reason for this success. Figure 2 attempts to illustrate the current landscape of quantitative NMR (named qNMR in the rest of this manuscript). It shows that the classical toolbox of the NMR spectroscopists has enabled applications in various areas of science but that it would not have been possible without meeting the essential requirements of analytical chemistry, particularly in terms of accuracy. These requirements must be considered at all stages of methodological developments in qNMR, and they are dictated by the corresponding applications. Figure 2 also highlights that qNMR is still a young research area, because major application domains remain out of its reach, such as forensics, geochemistry or environmental sciences, where the low concentration of analytes and the complexity of samples are extremely challenging. In these fields, NMR is often surpassed by mass spectrometry (MS), which is much more sensitive but suffers from a more limited quantitative performance and from its destructive nature.
Therefore, there are still major challenges to be overcome by qNMR so that its scope of applications can be significantly extended. The major challenges – resolution and sensitivity – are of course not new and not specific to qNMR. However, while these bottlenecks have been widely addressed by the NMR community over the last decade (particularly sensitivity with the renaissance of hyperpolarization8), some of the most recent NMR developments have not yet been applied to qNMR. Given this background, it appears timely to discuss the main challenges in qNMR, as well as some solutions that could be considered to overcome them. The goal of this perspective is not to provide an extensive review of the field of qNMR (the reader is referred to recent reviews on the subject14-20) but rather to offer a modest and personal point of view on the present and future of this exciting research field. The key concepts in qNMR are first summarized; then, the major part of this article is dedicated to the most recent evolutions in terms of resolution and sensitivity, while keeping in mind, as a background, the key concepts of analytical chemistry.
Key Concepts in Quantitative NMR
Definitions
The quantitative nature of NMR has been formulated in many different ways in the literature. The qNMR terminology is often used without distinction, whatever the method, the measured quantity and the application, and sometimes without any indication on its accuracy. Therefore, it seems necessary to harmonize the expressions so that scientists speak a common language. There is a real educational challenge for qNMR, i.e. making sure that the whole NMR community agrees on a common terminology. Recent contributions on the validation of qNMR methods will certainly help progressing along this direction.15, 21-23 The main definitions are summarized in this part to provide a basis for the next paragraphs.
The most general equation describing the quantitativity of the NMR signal is S = k∙N. In this expression, S is the signal intensity (area or volume), N is the number of spins giving rise to this signal, and k is a proportionality constant. The latter depends on numerous factors such as the spectrometer, the probe, the NMR pulse sequence, the temperature and the sample itself. As a consequence, knowing the exact value of k is a utopia, but quantitative results can still be obtained provided that k is stable during a given experiment (or series of thereof). Another consequence is that the absolute number of spins is not easily accessible, and only signal ratios can be determined. Therefore, according to the Comité Consultatif pour la Quantité de Matière (CCQM),24, 25 NMR can be classified as a primary ratio method. ‘Primary’ refers to the fact that there are no empirical factors in the description of the physical phenomena, while ‘ratio’ indicates that a standard is necessary (contrary to primary direct methods that measure the value of an unknown without reference to a standard). Practically, there are three different qNMR approaches26: (i) ratio measurements, (ii) content measurements and (iii) purity determination. The first one is often qualified as relative approach, while the two others are considered as absolute methods.
- The trueness is the agreement between the measured value (the NMR signal) and the true value (the metabolite concentration).
- The precision is the closeness of agreement between a series of measurements obtained from multiple sampling of the same sample under the prescribed conditions. It can be evaluated in terms of repeatability, intermediate precision or reproducibility. For accurate definitions, the reader is referred to appropriate norms.27
- The limit of quantification (LOQ) defines the lowest amount of analyte that can be quantified with suitable precision and trueness.
- The linearity of a qNMR method is its ability to give results that are directly proportional to the measured quantity.
The importance of trueness and precision
Trueness and precision (both being indicators of the accuracy of a method) are crucial for quantitative applications of NMR. The target value for trueness is application-dependent: While a trueness of a few percent can be sufficient to compare biological samples from different sample groups with large inter-group variations,28 a trueness better than 1% would be expected for purity determination29 or isotopic analysis at natural abundance.11 Trueness is generally achieved by relying on a reference signal, which can be internal, external or electronic. Alternative methods consist in relying on calibration or standard addition strategies where the analyte acts as its own reference. This is indispensable in multi-pulse experiments where the coefficient k is peak-dependant. More details about reference methods can be found in ref.30
Precision is often disregarded in qNMR publications, while it is extremely important to define the reliability of the quantitative result. For example, if one wants to compare the concentration of metabolites in biological samples where variations of 10–20% are expected, a precision of a few percent on the NMR measurement will be sufficient to ensure that the detected variations arise from actual biological differences and not from the method itself. On the contrary, some applications of qNMR require a precision as good as 0.1%; this is the case of 13C isotopic NMR at natural abundance, where very small variations in the natural 13C abundance between samples from different origins need to be measured. In addition, precision does not have the same meaning if it is measured in terms of repeatability (i.e. the experiment is repeated several times on the same instrument and by the same operator) or in terms of reproducibility (i.e. the experiment is repeated on different instruments in different laboratories and at different times). Obtaining a repeatability of 1% is much easier than obtaining a reproducibility of 1%, but the two terms often get mixed up in the literature.
These examples show that writing ‘qNMR’ in an article is not sufficient to fully characterize the quantitativity of a method. The development and the application of an NMR method for quantitative analysis should always be associated with a mention of its trueness and precision. We would like to suggest that the authors of future publications in qNMR include a statement such as “qNMR method with a xx% accuracy and a yy% precision in terms of repeatability/reproducibility.” This would help authors and readers to speak the same language; it would help readers to reproduce the published results, and it would certainly increase the overall quality of scientific publications in the field.
Improving the Resolution
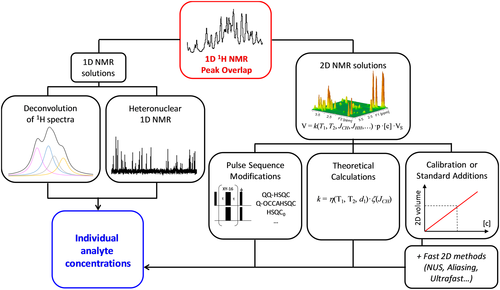
In addition to the educational challenge described in part 2, qNMR has to face major methodological challenges, and the first one is the signal overlap that becomes particularly problematic when complex mixtures are analyzed by 1H qNMR. The fields of metabolomics and natural products are particularly affected by this issue, because the ubiquitous peak overlap that characterizes the 1H NMR spectra prevents the accurate determination of peak areas. Resolution issues are further compounded by the strong dynamic ranges that generally characterize complex biological samples where analyte concentrations are distributed over a wide range of values. Fortunately, the last decade has witnessed large efforts geared at solving this overlap issue through different approaches capable of isolating the individual signals of multiple analytes in a mixture, while preserving a high level of trueness and precision. Figure 3 summarizes the main approaches that have been proposed to obtain individual analyte concentrations in mixtures whose 1H spectrum is overlapped. Without describing them in details, the next paragraphs summarize the pros and cons of each approach and the perspectives that could arise from further developments in the field.
1D 1H NMR
A first approach to extract the individual proton spectra from an overlapped 1H spectrum consists in determining – by deconvolution of the 1D NMR lineshapes – the individual 1D spectra of the different molecules present in the sample.31 This approach has the advantage of not requiring specific NMR acquisitions and is compatible with the classic 1D pulse sequences routinely applied in metabolomics. This processing strategy yields a trueness of 10–20%, but it is appropriate only when the overlaps are relatively limited and when all the mixture components are known. Indeed, the mathematical deconvolution relies on databases that are obtained with specific instrumental conditions and are specific of a certain matrix. Therefore, while the deconvolution methods can solve overlap problems in targeted situations, 32 it seems rather unlikely that they can be used as a standard approach in qNMR of complex samples, given the diversity of samples and biological questions that can be envisaged. The most promising solutions probably rely on methods that separate the data at the acquisition stage, as described in the next paragraphs.
1D heteronuclear NMR
qNMR of heteronuclei is often an appealing solution to improve the resolution, and qNMR studies on nuclei such as 13C,5 15N,33 31P34 or 17O35 were reported very early. Unfortunately, the most interesting nuclei are those with the largest chemical shift ranges such as 13C or 15N, but they are also the less sensitive ones, due to their low natural abundance and to their low gyromagnetic ratio. As a consequence, relying on heteronuclei for quantitative measurements requires either highly concentrated samples or very long measurement times. This is not an issue in applications where a large amount of sample is available: This is the case of many food applications such as the quantitative analysis of oils34, 36 or the authentication of the origin of small molecules by 13C isotopic NMR.37, 38 However, when the amount of sample is limited or when the concentration of the targeted compounds is low, the SNR that can be obtained in a reasonable time is often not sufficient to enable quantitative applications. In the field of metabolomics, for instance, the sensitivity of heteronuclear methods at natural abundance is not adapted to the detection of metabolites in complex mixtures, and they are often associated with 13C-enriched samples, an approach which is particularly useful in the field of fluxomics.39 Because heteronuclear NMR is barely compatible with the high-throughput demand of metabolomics studies, very few applications at natural 13C abundance have been reported.40, 41 Therefore, there is a considerable place for the development of more sensitive methods (as discussed later in this manuscript) that could boost the sensitivity of heteronuclear qNMR.
Conventional 2D NMR
An alternative solution consists in relying on multi-dimensional NMR, which has the advantage of offering a much better discrimination of resonances than 1D NMR, as the peaks are spread along one (or more) orthogonal dimension(s).6, 42 However, the use of 2D NMR for quantitative analysis has been expanding only over the last decade,43-45 and there are two main reasons explaining this late development.45 The first one – discussed in the Fast 2D NMR section – is that 2D NMR suffers from long acquisition times because of the need to repeat numerous 1D experiments with incremented delays in order to obtain a well-resolved 2D matrix. The second one is the complexity of the 2D NMR peak response that is highly site specific. Indeed, the 2D peak volumes are still proportional to the analyte concentration (as for the peak area in 1D NMR), but the coefficient of proportionality k is peak-dependent, as it is affected – in a complex manner – by J-couplings, relaxation, pulse sequence delays, pulse angles and off-resonance effects. Therefore, one must find a way to get rid of this constant for each peak to be used for quantification. Figure 3 depicts several approaches that have been proposed to deal with this bottleneck.
The first family of approaches consists in modifying the pulse sequence itself to remove the dependence of k on the factors mentioned in the preceding texts. Efforts have mainly focused on HSQC pulse sequences, with experiments of the quick quantitative (QQ)-HSQC family where the peak volume is compensated for off-resonance and/or J-couplings.46-48 Still, the trueness of these methods is in the 10–20% range, and the approach is not general as it does not account for the T2 dependence of peak volumes. Note that the sensitivity of this approach has been significantly improved very recently by combining it with pure shift strategies (see also Pure shift experiments section).49 Another recent and very promising approach is the HSQC0, where time-zero 2D peak volumes are calculated by extrapolating the peak volumes recorded on 3 HSQC spectra of the same sample obtained with incremented repetitions of the same pulse sequence.50 This approach has been successfully applied to biological extracts50 and also to the elucidation of the structure of lignin, in an article where the HSQC0 and QQ-HSQC were compared.51 HSQC0 may, however, suffer from losses in sensitivity for analytes with short transverse relaxation times.
These methods are quite elegant, because they do not require a priori knowledge on the targeted analytes. They must be used together with a reference method, as in 1D qNMR experiments. Still, some improvements are needed to improve their accuracy and precision, and future years may witness interesting developments along this direction. Prospective developments in this field could consider the extension to other pulse sequences (so far, these methods are limited to HSQC) and to fast methods (especially for the HSQC0 method that requires three experiments per sample).
A second family of methods aims at calculating the exact value of the proportionality coefficient k for each peak that needs to be used for quantification, which directly gives access to the absolute concentration of the corresponding metabolite.52 While very elegant on the paper, these methods are quite impractical, because they require an accurate determination of coupling constants and relaxation times, as well as the exact knowledge of the transfer function defining the expression of k. So far, the reported trueness for these methods is in the 10–20% range, and major developments will probably be needed before they can be applied.
The last family of methods for 2D qNMR includes methods relying on external calibration from standard samples, as for many other analytical techniques such as spectrophotometry, chromatography or Mass Spectrometry.45, 53 A calibration curve must be obtained for each peak of interest, but these curves can be obtained from a single series of standard samples containing all the targeted analytes in known concentration. This approach has several advantages: It is simple and general, as it can be combined with any 2D pulse sequence. In particular, as regards resolution improvements, interesting perspectives arise from multiple-quantum experiments that offer an efficient way to disentangle overlapping resonances.54 The calibration method is also quite fast, because hundreds of samples can be analyzed from the same calibration curves if the experiment is repeatable. Here, trueness is evaluated from the quality of the calibration curve, which is linear in most cases (exceptions have been recently reported55).
A drawback of the calibration method may arise from the potential differences (in terms of pH, ionic strength, etc.) between the standard mixture used for calibration and the samples to be quantified. Indeed, the NMR response of the external standards may differ from the one of the samples of interest. As a consequence, special care should be taken so that the content of the calibration samples reflects the complexity of the targeted samples. This drawback can also be circumvented by standard addition approaches, where the sample is spiked several times with a mixture of standards.28 While more accurate, this approach is far longer because all the samples of interest should be spiked, which is not compatible with high-throughput studies. On the whole, calibration approaches have been the most widely applied in the recent literature, because they provide a high trueness and precision (typically better than 5%). They are very efficient for the quantification of multiple analytes in complex mixtures; however, they are limited to the quantification of compounds for which a commercial standard is available. This is the case of most targeted compounds in metabolomics, where the calibration method has recently found numerous applications.56
A last challenge worth mentioning in quantitative 2D NMR is the signal processing issue. In most 2D qNMR studies, peak volumes are determined by integration, an approach which is easy to apply in routine but is very sensitive to baseline distortions, t1 noise and tailing of adjacent peaks. Promising strategies have been proposed to perform a reproducible analysis of 2D NMR spectra relying on a parametric model fitting approach to spectral deconvolution.57 In particular, fast maximum likelihood reconstruction was shown to be more accurate than integration and seems a very promising approach.58 This method is currently not routinely implemented, and interesting perspectives arise from its implementation within commercial NMR software, where it could be advantageously combined with the acquisition methods mentioned in the preceding paragraphs.
Fast 2D NMR
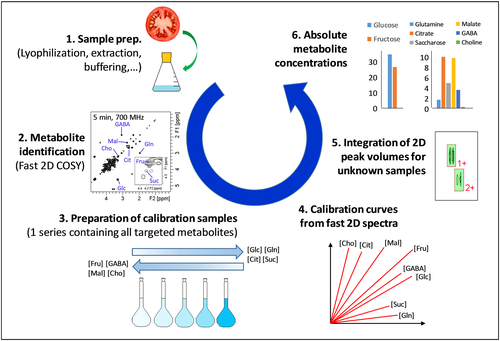
While 2D NMR methods offer a convenient way of improving the resolution, they suffer from long experiment times that are detrimental to high-throughput analysis. Moreover, long experiments generally suffer from a lower repeatability because they are more likely to be affected by hardware instabilities. This problem is not specific to qNMR, and the last 30 years have seen tremendous efforts from a large part of the NMR community to reduce the acquisition time of multi-dimensional experiments.59 Many approaches have been proposed, from fast pulsing experiments to reduce the sampling of the indirect time domain in a uniform or non-uniform fashion, to more exotic methods such as Hadamard spectroscopy or ultrafast (UF) 2D NMR. Few of them have been applied to quantitative 2D NMR, but recent studies have shown that spectral aliasing, non-uniform sampling (NUS) and UF 2D NMR were compatible with the precision requirements of 2D qNMR.60, 61 UF 2D NMR, where the complete 2D NMR dataset in recorded in a single scan, is particularly immune vis-à-vis hardware instabilities, and a repeatability of a few percent has been reported.62 UF 2D NMR suffers from a relatively low sensitivity, but this drawback can be partially circumvented by relying on hybrid methods offering a reasonable compromise between the experiment duration (a few minutes) and the sensitivity (micromolar concentrations can be detected on homonuclear 2D spectra of biological extracts). Figure 4 summarizes the analytical workflow showing how metabolite concentrations in plant extracts can be retrieved from fast 2D COSY spectra obtained in 5 min, relying on a series of calibration samples containing all the targeted analytes in known concentration.63
Pure shift experiments
Aside from the methods described in the preceding texts, which share the common aim of increasing the spectral width to improve the peak separation, the recent years have seen numerous developments to reduce overlapping on 1D 1H spectra by homonuclear decoupling. Different strategies have been described, such as those relying on the spatial encoding of frequencies64 or on bilinear rotation decoupling building blocks.65 These approaches – which are also applicable to 2D NMR – form an entire research field by themselves, with exciting methodological developments in the last few years.66-68 Pure shift methods often suffer from spectral artifacts and from a low sensitivity – the latter drawback mainly concerns gradient-encoded methods. However, their performance is continuously improved. Pure shift methods have almost not been applied in a quantitative context, probably because the peak intensities are strongly modified in a signal-dependent fashion. However, this issue is similar to the one described in the preceding texts for 2D NMR, and for all multi-pulse sequences in general. Efforts geared at improving the quantitative performance of these experiments – via pulse sequence modifications or calibration procedures – could open exciting perspectives for qNMR. A first step in this direction has been taken very recently by Mauve et al.49 who reported the successful incorporation of pure shift in quantitative 2D experiments (see also Conventional 2D NMR section).
The Quest for a Higher Sensitivity
The second methodological challenge that NMR has to face is its low sensitivity. This issue is not specific to qNMR, but it is even more serious when quantitativity is concerned, because the peaks of interest generally need to have a sufficient SNR so that they can be quantified with a sufficient precision. In 1D NMR for instance, it is generally admitted that the precision on the integration of a given peak area is approximately = 1/(2∙SNR); as an example, a precision of 0.1% requires a SNR of 500 at least.69 Unfortunately, the various approaches discussed in the preceding paragraphs to improve the resolution often come at a price in terms of sensitivity, either due to the low sensitivity of heteronuclei and/or to the lower sensitivity per unit of time of multi-dimensional methods (particularly UF 2D NMR). This low sensitivity is detrimental to numerous applications where the amount of sample is limited, and this is the main reason explaining why qNMR is not yet the technique of choice in environmental or forensic applications where quantitative analysis is of the utmost importance. The hardware NMR developments (higher fields, cryogenic probes, microcoils, etc.) have significantly improved this sensitivity, but NMR is still several orders of magnitude less sensitive than the most sensitive MS techniques. As a consequence, there is an urgent need to investigate methods capable of significantly boosting the sensitivity of NMR. Recent years have witnessed the renaissance of hyperpolarization approaches providing very promising solutions along this path.8 Several approaches have been proposed, capable of preparing nuclei in ‘hyperpolarized’ metastable spin arrangements in which the bulk nuclear polarizations depart from their usual (ca. 10−5) Boltzmann distributions and approach unity values. Once prepared and transferred into an NMR spectrometer, the ‘super-signals’ that can be elicited from these spin arrangements can be exploited within a timescale dependent on the longitudinal relaxation time T1 of the hyperpolarized nuclei. Methods for producing and exploiting these extreme spin-polarization levels include the use of para-hydrogen,70, 71 the optical pumping of noble gases72, 73 and the microwave-driven dynamic nuclear polarization (DNP) from unpaired electrons.74-76 The para-hydrogen-induced polarization (PHIP) and DNP methods seem the most adequate for applications to analytical chemistry, and promising perspectives would arise from their application to quantitative issues. However, because these strategies are quite recent, the question of their quantitative performance (particularly in terms of trueness and precision) remains to be answered, but recent papers, described in the next paragraphs, have opened interesting perspectives along this avenue.
Para-hydrogen-induced hyperpolarization
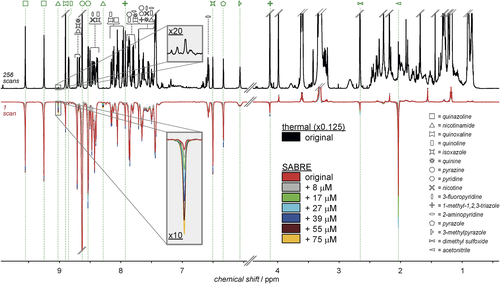
PHIP is based on the incorporation of para-hydrogen (p-H2) into a targeted analyte by a catalytic hydrogenation reaction.71 This approach was initially limited to substrates that could effectively be hydrogenated, but it has been generalized to a wider range of analytes through the signal amplification by reversible exchange (SABRE) method.70 In SABRE, the hyperpolarization is transferred from p-H2 to the substrate via a mediating metal complex, which considerably enlarges the applicability of this hyperpolarization approach. This approach is quite recent, but the very last years have seen considerable efforts from the group of Tessari to make it applicable to quantitative analysis. They demonstrated that the initial SABRE approach was not applicable for quantification, because the signal depends on numerous molecular parameters, but they proposed an alternative strategy consisting in adding a second ligand in large excess compared with the analyte.77 In these conditions, their approach yields a linear dependency of the signal integrals on the concentration, allowing quantitative analysis relying on standard addition curves.9
Figure 5 illustrates how this approach can be used to detect and quantify, in a single scan, multiple analytes at micromolar concentrations in complex mixtures of small molecules through a standard addition approach. The SABRE approach is compatible with the acquisition of 2D spectra that can help improving the resolution when the complexity increases,78 and an application to the quantification of flavor components in a coffee extract has recently been published.79 The precision of this approach remains to be evaluated and optimized (the current repeatability is estimated to 10–20%), but these first steps appear extremely promising. A drawback of the SABRE method is that it is currently limited to species that can reversibly bind to the metal complex – so far, compounds containing at least one nitrogen lone pair. However, as recently shown, this drawback can be turned into an advantage in order to target specific compounds in a complex mixture.79 The limit of detection of this chemosensing approach is in the low-micromolar range.
Dynamic nuclear polarization
DNP relies on the transfer of polarization from unpaired electrons to nuclear spins, by irradiating the electrons at their Larmor frequency.75 The sample to be analyzed needs to be co-mixed with a free radical, frozen in a glass at cryogenic temperatures and hyperpolarized by irradiating the radical closed to the Larmor frequency of the unpaired electrons. In 2003, DNP was made compatible with liquid-state NMR detection through a two-magnet experimental setting consisting in rapidly melting the hyperpolarized sample and transferring it to a liquid-state NMR spectrometer.76 This dissolution-DNP (D-DNP) experiment enhances the sensitivity of the NMR detection by 4 to 5 orders of magnitude, provided that the nuclear T1s are long enough to preserve the hyperpolarization during the sample transfer. Since 2003, most applications of D-DNP have dealt with the injection of pure hyperpolarized 13C-labeled molecules such as pyruvate into living organisms,80 but very few applications to mixtures have been reported, a field where D-DNP would open numerous perspectives to quantify low-concentrated analytes in complex biological samples such as extracts or biofluids.
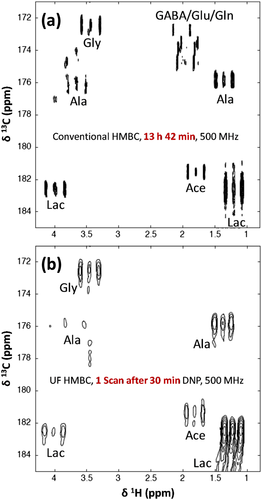
Preliminary results exploring the potential of D-DNP for the analysis of biological extracts have been recently reported.81 These complex metabolite mixtures represent a challenging example: Their quantitative analysis by 1H NMR is limited by peak overlapping, and their concentration is too low for heteronuclear qNMR. The initial D-DNP setting was not suitable for the analysis of such mixtures, because 13C spin diffusion – one of the key processes for DNP – is not efficient in dilute samples at natural abundance.82 However, it has recently been demonstrated that this limitation could be efficiently circumvented through 1H → 13C cross-polarization.83 This approach was successfully applied on plant (tomato fruit) extracts.81 It is a non-selective method, but the observable signals are limited to 13C with relatively long T1s (several seconds); however, solutions to circumvent this drawback are currently being explored.84 2D spectra can also be recorded using UF 2D pulse sequences whose single-scan character is compatible with the irreversibility of the D-DNP experimental setting.81, 85 This approach was successfully demonstrated on breast cancer cell extracts (Fig. 6). The quantitative potential of this methodology remains to be explored, but it could offer promising perspectives for the quantitative analysis of complex samples. An important step has been taken in this direction through the first evaluation of the repeatability of the D-DNP experimental setting.86 An average precision of 3.6% on relative peak areas for signals above the LOQ has been reported on plant extracts, which is very encouraging in a quantitative perspective. Next steps toward the quantitative analysis of complex samples by D-DNP will necessarily include an evaluation of its linearity, so that it can be associated with calibration or standard addition procedures, similarly to the SABRE method.
Quantitative NMR in 2026
- More sensitive, in particular through the exploitation of hyperpolarization methods (such as DNP and SABRE) toward quantitative ends;
- Better resolved, through the development of accurate and robust quantitative multi-dimensional NMR methods;
- High throughput, thanks to the generalization of fast multi-dimensional methods and the development of automated and robust data processing procedures.
These evolutions should open new application perspectives for qNMR, in particular in fields such as metabolomics, forensics and environmental sciences, where the sample complexity and the low analyte concentrations are particularly challenging. It is relatively straightforward to foresee the huge impact of qNMR if its sensitivity was improved by several orders of magnitude, a goal which appears realistic considering the most recent advances in the field of hyperpolarization. Quantifying pollutants in dilute environmental samples, detecting sub-micromolar biomarkers in biofluids, using isotopic NMR in forensics…all these applications would then become accessible on a routine basis to a broad community of potential end-users who currently prefer to rely on alternative analytical methods.
- User-friendly data acquisition and processing tools, ensuring that these methods can be easily implemented and applied;
- Thorough analytical validations, to ensure the reliability of the results obtained with these methods.
- Efforts from the NMR community to publicize these methods among a wide audience of potential end-users, including fields where the potential of qNMR is currently underestimated.
The perspectives discussed in this article are not exhaustive, and many other exciting ideas will certainly arise from the NMR spectroscopists' imagination, leading to the emergence of novel quantitative methods that will pave the way to applications we are not presently able to conceive.
Acknowledgements
The author is grateful to members of the EBSI group (CEISAM, Université de Nantes) and to collaborators for inspiration and discussions and thanks Dr. Marco Tessari (Radboud University) for providing the high resolution version of Fig. 5. Michel Giraudeau is also acknowledged for linguistic assistance. Financial supports from the Région Pays de la Loire (grant Résonantes) and from the CORSAIRE metabolomics platform are also acknowledged.


